Glidepath Lab: An Introduction to the Methodology
lazyeconomist.com · Methodology series, Paper 1 of 3 · September 2026 · engine v0.4
Engine, API, the browser workbench and the six-factor memo generator — which builds a versioned evidence document from a saved run — are live at glidepath.lazyeconomist.com.
Why another glidepath model
Target-date funds hold $4.8 trillion and receive nearly two-thirds of participant contributions. Until 2025 almost none of that money touched private markets. An executive order, a proposed Department of Labor safe harbor, a Supreme Court case and a wave of product launches have changed the question from whether a private sleeve can sit inside a 401(k) default to how large, in what shape, at what cost and with what liquidity guardrails.
The models that answer those questions today are proprietary. Each provider publishes a headline — 50 basis points a year, 15% more wealth over forty years, 7–8% more retirement income — derived from its own capital market assumptions and its own product. A plan committee cannot see the assumptions, cannot change them, and cannot test the one thing the 2026 private-credit gates made vivid: what happens when the sleeve cannot be sold.
Glidepath Lab is an open simulator built to close that gap. It takes a plan’s own demographics and cash flows, a glidepath with public and private sleeves, a set of return assumptions the user controls, the actual terms of the vehicles being considered, and a library of stress scenarios. For each it reports what a participant’s retirement income looks like, alongside the probability that the sleeve’s redemption cap binds, the fee hurdle the sleeve must clear, and evidence organised around the six factors in the proposed DOL rule. That evidence comes back as the JSON result of an API call and as the charts of the browser workbench, and the memo generator assembles it into a versioned six-factor document a fiduciary can print.
Three commitments
The methodology rests on three commitments, each a response to something the research literature made clear.
The premium is a scenario, not a constant. Estimates of the return premium private assets earn over their public funding asset span a wide range. Provider capital market assumptions imply two to three percentage points for buyout and direct lending; the one published backtest of a diversified TDF found about fifteen basis points at the fund level; AQR’s current point estimate for private equity is no premium at all, on the argument that once investors value illiquidity as a feature they pay for it rather than being paid for it. A model that hard-codes any one of these numbers is making the allocation decision before the committee sees it. Glidepath Lab runs every configuration across a premium grid — by default 0, +1, +2 and +3 percentage points — and reports the break-even premium the sleeve must earn after fees for the median participant to be no worse off. Where a committee’s own assumption falls on that grid is the committee’s decision.
Risk is measured on economic, not reported, returns. Private assets are appraised quarterly and their reported returns are smoothed. Every serious source, including the providers, agrees that the resulting low volatility and low correlation are artefacts of infrequent pricing rather than properties of the assets, and that an optimiser fed reported series will over-allocate. The Lab keeps two return series for every private sleeve. The economic return is the true value of the assets, and it drives risk. The reported return drives what the participant sees, what the fund’s NAV shows, and what rebalancing and redemption decisions are made against — and, because the reported balance is the one a participant transacts at, what she receives on the day she leaves or retires. The gap between the two is the transfer from the plan’s perspective, and a first-class output: it is where switching-fairness problems and retirement-date surprises live.
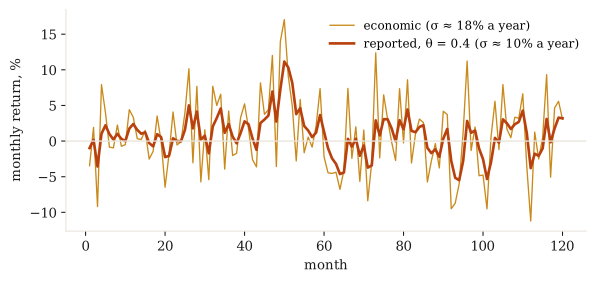
Figure 1. One ten-year path of a private-equity sleeve. The amber line is the economic return the engine uses for risk; the rust line is what the appraisal filter reports with θ = 0.4. The ratio is √(θ/(2−θ)) = √(0.4/1.6) = 0.5: reported volatility is roughly half of economic volatility (the legend shows this path’s sample values).
Worked example — the smoothing arithmetic. Suppose a sleeve’s true monthly return is +3% one month and −3% the next. With θ = 0.4 and a prior reported return of 0.6%, the reported series is 0.4 × 3% + 0.6 × 0.6% = 1.56%, then 0.4 × (−3%) + 0.6 × 1.56% = −0.26%. The reported swing is 1.8 points where the true swing was 6. Committees reading reported histories see a fraction of the risk they own.
Liquidity is a plan-level property with hard caps. A participant who leaves does not sell her share of a private fund; the plan meets her rollover from contributions, netting and public sleeves. That is why modest illiquid sleeves work in practice. But the sleeve itself can only be reduced at the rate the vehicle allows — typically 5% of net asset value per quarter — and 2026 showed that when requests exceed that cap, funds pro-rate and backlogs persist for quarters. The Lab models plan cash flows month by month, applies the vehicle’s cap as a hard constraint, tracks backlogs and gates, and records how far the private weight drifts above target after a public drawdown when it cannot be rebalanced through the cap. Past a hard tolerance the engine sells the excess immediately at a discount rather than waiting, and books the discount as a cost. The layoff and the retirement-date stale mark are scenarios in the library, not footnotes; a merger is a plan event you supply directly.
Worked example — the cap arithmetic. The demo’s private-credit vehicle holds $8 billion and allows 5% of NAV per quarter: $400 million of redemptions can be met in a normal quarter. The demo plan’s private-credit sleeve is about 5% of a plan whose assets grow to a few billion dollars, so in a calm quarter the plan’s own requests are a rounding error against that capacity. In the BCRED-style scenario other investors ask for 9% of NAV, $720 million, for four quarters running. The vehicle fills 5/9 of every request pro rata, so the plan gets 56 cents on the dollar of what it asked for, and the unfilled 44% joins a backlog that competes again next quarter. Four quarters of that is a sustained gate.
Worked example — netting. In a month where younger cohorts subscribe $30 million to the sleeve and retiring cohorts redeem $20 million, the two cross inside the plan first: the vehicle sees a $10 million net subscription, no redemption request at all, and the cap never enters. Netting is why contributions are the first line of liquidity and why a young plan can carry a larger sleeve than an old one.
What the model does
A run proceeds in four stages.

Figure 2. One run: inputs → lifecycle → liquidity → fees → results, executed for every scenario, every premium on the grid, with and without the sleeve, across every Monte Carlo path.
Lifecycle. The engine groups participants into entry-age cohorts with salary, contribution, match and separation assumptions. Headcount and separations follow deterministic expected-value paths, so only returns are drawn per Monte Carlo path. Each cohort’s balance is simulated monthly along the glidepath over thousands of paths. Public assets follow the user’s capital market assumptions; private assets follow their funding asset plus the scenario premium, a manager-dispersion draw and, for private credit, a deferred-loss mechanism that recognises losses economically before they appear in reported NAV. Balances at the target date are converted to retirement income and expressed as a replacement ratio.
Liquidity. In parallel, the engine simulates the plan’s aggregate cash flows: contributions in; separations, rollovers, loans and hardship withdrawals out (post-retirement decumulation runs at a systematic withdrawal rate, not a separate RMD rule); rebalancing trades between sleeves. Public sleeves absorb net flows first. The private sleeve trades only to rebalance, and only within its cap, except when the private weight has drifted past a hard tolerance — then the engine forces an immediate sale outside the cap at a discount. Excess redemption requests otherwise queue. The engine reports how often the cap binds, for how long, how large the backlog gets, and what forced sales cost.
Fees. Each sleeve carries a full fee stack — management, incentive with hurdle and optional catch-up, acquired-fund and platform layers — and the engine computes the fund’s total expense ratio before and after the sleeve at every point on the glidepath. The engine then solves for the break-even premium, net of fees; a gross figure (adding the sleeve’s fee stack back in) is planned but not yet computed.
Memo. The six-factor document — performance, fees, liquidity, valuation, benchmarking, complexity — is generated from a finished run. Every figure it cites is one the JSON result already carries, and it is stamped with the run it came from, the engine version, a hash of the inputs and the premium its sentences cite, so it can be reproduced exactly. Each section ends in a note the fiduciary writes; regenerating produces the next version against the same run. The technical note lists, section by section, what stands behind each factor.
What the model does not do
It does not select managers, and it does not pretend the dispersion problem away: manager alpha is a distribution the user sets, centred on zero by default. It does not model drawdown funds with capital calls in the first release; it assumes evergreen or interval vehicles, which is what DC-purpose products are. It does not hold live fund data. It does not produce a recommendation for any specific plan. Its default assumptions are illustrative and are cited to their sources in the companion technical note (citing them directly in an interface is planned along with the interface itself).
How to read the outputs
Three outputs carry most of the decision weight. The first is the income distribution at each premium scenario, read against the no-sleeve baseline: if the sleeve only helps at +3 points, the committee is betting on manager access it may not have. The second is the liquidity picture: a cap-binding probability that rises steeply with sleeve size is the practical ceiling on allocation, whatever the return case says. The third is the break-even premium: where it sits relative to the committee’s own assumption is the fee conversation in one number.
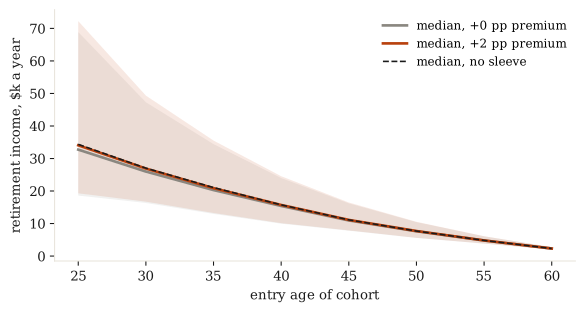
Figure 3. The income fan for the demo plan (500 paths): median income by cohort entry age at +0 and +2 percentage points of premium, with the 5th–95th percentile bands, against the dashed no-sleeve median. Where the rust line sits relative to the dashed one is the return case in a single picture.
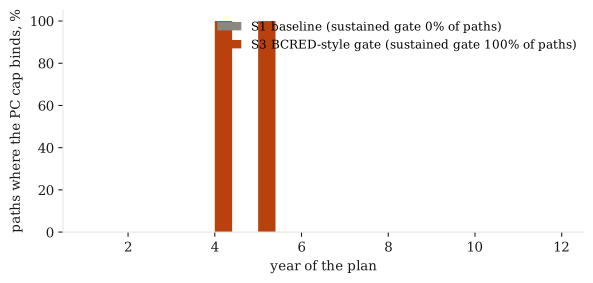
Figure 4. How often the private-credit vehicle’s redemption cap binds in each year of the plan: baseline (grey) against the BCRED-style request spike (rust). The legend carries the share of paths in which the gate is sustained for three or more quarters.
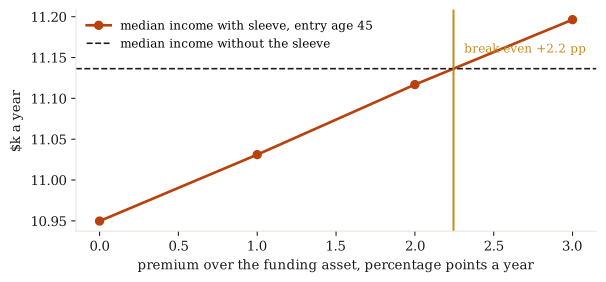
Figure 5. The median cohort’s income at each premium on the grid (rust) against income without the sleeve (dashed). The amber marker is the break-even premium: the annual return over the funding asset the sleeve must earn, net of its fee stack, to leave the median participant no worse off. Where a committee’s own assumption sits relative to that marker is the fee conversation in one number.
What is live today
| Status | |
|---|---|
| Lifecycle, liquidity and fee engines; the scenario library S1–S7 | live |
| The browser workbench: build a plan, run it, read the results | live |
| Saved plans and assumption sets over the API | live |
| Notice-period vehicle terms; the request wait, and a count of the months spent above the band | live |
| Cap-relevant fee basis, sleeve tags and allocation constraints | live |
| Earnings bands, retirement targets, bulk transfers and allocation floors | live |
| The six-factor memo generator: an evidence document built from a saved run, versioned and printable | live |
| The workbench page: every saved run and plan, listed and reopened | live |
| A side-by-side comparison of two saved runs, or of two memos | not built |
| A memo that cites a stored assumption set by name | not built; a memo reports how far its run’s assumptions sit from the shipped defaults |
| A gross break-even premium alongside the net figure | planned |
| Drawdown funds with capital calls, regime-conditioned scenarios, CSV glidepath import, re-enrolment, the switching-fairness transfer | v2 |
The companion technical note sets out the equations, defaults and tests behind each engine. The FAQ answers the questions committees and consultants ask most often.
An introduction to the methodology · Technical note · Frequently asked questions